Multiple options exist to further tune-in your Kowabunga setup.
This is the multi-page printable view of this section. Click here to print.
Customization
Welcome to your private Cloud !
1 - Cloud-Init bootstrap
Customize your private Cloud instances.
Cloud images are operating system templates and every instance starts out as an identical clone of every other instance. It is the user data that gives every cloud instance its personality and cloud-init is the tool that applies user data to your instances automatically.
Kowabunga Kahuna comes with pre-bundled cloud-init templates which are then deployed into /etc/kowabunga/templates configuration directory.
Supporting both Linux and Windows targets, they come with the usual:
- meta_data.yml file, providing various metadata information, that can be further reused by Kowabunga agents.
- network_config.yml file, allowing for proper automatic network stack and interfaces configuration.
- user_data.yml file, providing a sequence of actions to be applied post (initial) boot, as described in its standard documentation.
Note that all these files are based on Go Templates. They are used by Kahuna to generate instance-specific configuration files and bundled into an ISO9660 image (stored on Ceph backend), ready to be consumed by OS, and written/updated each time a computing instance is being created/updated.
Warning
Kowabunga currently only provide admin-level cloud-init templating support. Templates are defined and maintained at admin level for the global platform. There’s no present way to fine-tune cloud-init templates per project, as override.Linux Instances
Most of Linux distributions these days natively support cloud-init standard. As long as you’re virtual machines boots up with an associated emulated CD-ROM ISO9660 image aside, you’re good to go.
Note that Kowabunga cloud-init template natively provide the following post-actions:
- Setup network interfaces, DNS and gateway.
- Set instance hostname and FQDN.
- Update package repositories.
- Install basic packages, including QEMU agent.
- Set initial root password.
- Provision service user, ready to further bootstrap instance.
- Adds a /usr/bin/kw-meta wrapper script, friendly use to Kowabunga instance metadata retrieval.
- Wait for Internet connectivity/access.
Microsoft Windows Instances
Microsoft Windows OS is a different story than Linux as there’s no default cloud-init implementation bundled.
One can however cope with such limitation thanks to the Cloudbase-Init project which provide cloud-init compatibility and is the “The Quickest Way of Automating Windows Guest Initialization”. It supports Windows 8+ and Windows Server 2012+ OS variants.
Its usage implies a much more complex approach than Linux targets as it requires you to first build up your private custom Windows disk image template, extending it with cloudbase-init.conf configuration file.
Once your image has been built, Kowabunga cloudbase-init supports all options from the NoCloud engine.
Note that Kowabunga cloudbase-init template natively provide the following post-actions:
- Setup network interfaces, DNS and gateway.
- Set instance hostname and FQDN.
- Install basic packages, including NuGet, Paket, PsExec, OpenSSH.
- Set PowerShell as SSH default shell.
- Update firewall rules.
- Set OS password security policy.
- Set initial root password.
- Provision service user, ready to further bootstrap instance.
From there on, you’ll get a ready-to-be-consumed Windows instance, which deployment can be further automated thanks to Ansible over SSH or any other provisioning tool or scripts.
It is then your responsibility to provide the Microsoft Windows license key (your Windows instance will anyway automatically shutdown after an hour if not).
Warning
Note that it is possible to bypass the license verification mechanism. This is only valid if you intend to use your instance as a temporary sandbox for development/testing purpose. Microsoft Windows licenses are not that expensive and in no way does the Kowabunga project encourage piracy.Shall you be willing to temporarily bypass such mechanism, you can do so with such an Ansible playbook for instance:
---
- hosts: windows

  vars:
    ansible_connection: ssh
    ansible_shell_type: powershell
    ansible_user: admin
    ansible_password: "SECURE_ADMIN_PASSWORD"

  tasks:
    - name: Accept EULA
      ansible.windows.win_shell: "PsExec.exe -accepteula"
      ignore_errors: true

    - name: Disable WLM
      ansible.windows.win_shell: "PsExec.exe \\\\127.0.0.1 -s -i sc config WLMS start=disabled"

    - name: Reboot hosts
      ansible.windows.win_shell: "shutdown /r"
2 - Metrology & Instrumentation
Monitor and instrument Kowabunga services
Kowabunga comes with bundled support for metrology and instrumentation. No one would ever deploy and maintain a blackbox infrastructure and support it empty handed.
If you’re SysAdmin (or DevOps, whatever the name now), and are willing care about monitoring, you’re got 2 options:
- Use you’re already existing and in-place monitoring stack and tools.
- Rely on Kowabunga-bundled ones.
In the second option, Kowabunga optionally comes bundled with:
- Grafana, VictoriaMetrics and VictoriaLogs, hosted on Kahuna server, providing logs and metrics TimeSeries database storage and observability dashboards.
- Grafana Alloy agent, hosted on Kahuna, Kiwi and Kaktus nodes, collecting data and streaming to Kahuna.
DNS Configuration
Let’s start by defining two new public endpoints for metrics and logs collection. We’ll expose them over HTTPS on Kahuna so that all infrastructure nodes will be shipping data to.
In our example, we’ll use metrics.acme.com and logs.acme.com as new receiving endpoint. Note that both endpoints will be filtered by HTTPS Basic Authentication so only genuine infrastructure nodes can push to. We’ll also be using grafana.acme.com as the monitoring instance. Please make sure to configure your DNS registrar accordingly (manually or through TF or such), so these subdomains match your Kahuna public IP address.
Client-Side Enablement
Next, we’ll extend our infrastructure’s declarations in Ansible. For that, we’ll:
- globally enabled metrology capability.
- enable agent’s deployment on all infrastructure instances.
- declare the public metrics and logs receiving endpoints.
- set secure credentials for client/server data shipment and collection.
As to do so, extend your platform’s ansible/inventories/group_vars/all/main.yml file with the following:
kowabunga_metrology_enabled: true
kowabunga_metrology_agent_metrics_enabled: true
kowabunga_metrology_agent_logs_enabled: true
kowabunga_metrology_server_metrics_public_url: "https://metrics.acme.com"
kowabunga_metrology_server_logs_public_url: "https://logs.acme.com"
and declare strong robust platform into ansible/inventories/group_vars/all.sops.yml:
secret_kowabunga_metrology_server_metrics_auth_password: ROBUST_PASSWORD_FOR_METRICS
secret_kowabunga_metrology_server_logs_auth_password: ROBUST_PASSWORD_FOR_LOGS
and apply for changes on all Kiwi and Kaktus instances:
$ kobra ansible deploy -p kowabunga.cloud.kiwi
$ kobra ansible deploy -p kowabunga.cloud.kaktus
Once done, all your private instances should now have a running Grafana Alloy agent, collecting the various local metrics (CPU usage, memory, network, disk, libvirt, Ceph …) and associated logs an pushing them to Kahuna remote endpoint.
Server-Side Enablement
It’s now time to handle server-side counter part. Let’s enable these into Kahuna’s configuration by extending the ansible/inventories/group_vars/kahuna/main.yml file:
kowabunga_metrology_dashboard_enabled: true
kowabunga_metrology_dashboard_public_url: "https://grafana.kowabunga.cloud"
kowabunga_metrology_server_metrics_enabled: true
kowabunga_metrology_server_metrics_retention_period: 7d

kowabunga_metrology_server_logs_enabled: true
kowabunga_metrology_server_logs_retention_period: 7d
and adding a secret for Grafana’s admin user in ansible/inventories/group_vars/kahuna.sops.yml:
secret_kowabunga_metrology_dashboard_admin_password: ROBUST_PASSWORD_FOR_GRAFANA_ADMIN
Note that in our example, we’ve limited metrics and logs retention server-side to 7 days. We’ll free to define different persistence duration that suits your needs.
Following Ansible collection documentation, you can also pre-configure additional Grafana users for your organization, e.g:
kowabunga_metrology_dashboard_extra_users:
  - name: John Doe
    login: jdoe
    email: jdoe@acme.com
    password: A_STRONG_ONE
Again, apply for changes on all Kahuna instance:
$ kobra ansible deploy -p kowabunga.cloud.kahuna
Once done, Kahuna will then starts collecting data from all infrastructure node (push, not pull) and Grafana will be ready to be consumed.
Provisioning Grafana dashboards
This stage unfortunately cannot be automated at the moment ;-(
Kowabunga comes bundled with ready-to-be-consumed dashboards. They are maintained in a dedicated GitHub repository and, if you’re familiar with Grafana, can’t be simply copy/pasted or imported.
Best option however is to take profit of Grafana v12 Git Sync feature. It allows you to seamlessly connect your Grafana instance to our (or yours forked one) GitHub dashboard repository.
Once configured, Grafana will automatically pull for any changes (so you’re always up-to-date) and any edition you’d make would automatically trigger a pull-request on save.
Setup can be performed (manually only) through Administration / Provisioning menu, as detailed below:
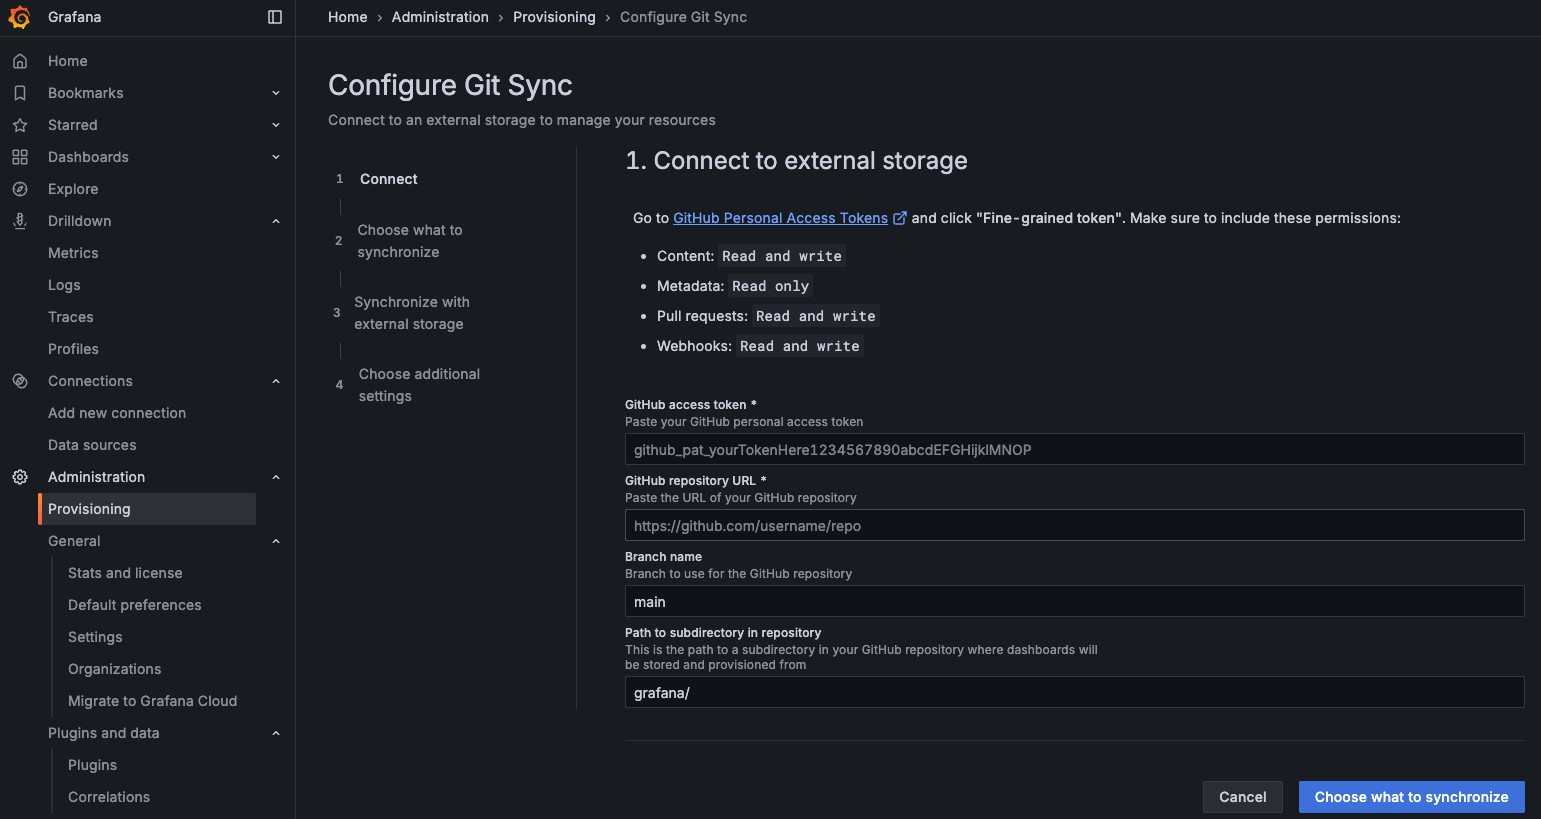
You’ll need to first setup a GitHub Personal Access Token (or PAT) to Kowabunga’ repository (or yours, for convenience).
Then simply forward the wizard:
- Repository URL: https://github.com/kowabunga-cloud/grafana-dashboards
- Branch name: master
- Path: grafana/
and wait for synchronization to happen.