Metrology & Instrumentation
3 minute read
Kowabunga comes with bundled support for metrology and instrumentation. No one would ever deploy and maintain a blackbox infrastructure and support it empty handed.
If you’re SysAdmin (or DevOps, whatever the name now), and are willing care about monitoring, you’re got 2 options:
- Use you’re already existing and in-place monitoring stack and tools.
- Rely on Kowabunga-bundled ones.
In the second option, Kowabunga optionally comes bundled with:
- Grafana, VictoriaMetrics and VictoriaLogs, hosted on Kahuna server, providing logs and metrics TimeSeries database storage and observability dashboards.
- Grafana Alloy agent, hosted on Kahuna, Kiwi and Kaktus nodes, collecting data and streaming to Kahuna.
DNS Configuration
Let’s start by defining two new public endpoints for metrics and logs collection. We’ll expose them over HTTPS on Kahuna so that all infrastructure nodes will be shipping data to.
In our example, we’ll use metrics.acme.com and logs.acme.com as new receiving endpoint. Note that both endpoints will be filtered by HTTPS Basic Authentication so only genuine infrastructure nodes can push to. We’ll also be using grafana.acme.com as the monitoring instance. Please make sure to configure your DNS registrar accordingly (manually or through TF or such), so these subdomains match your Kahuna public IP address.
Client-Side Enablement
Next, we’ll extend our infrastructure’s declarations in Ansible. For that, we’ll:
- globally enabled metrology capability.
- enable agent’s deployment on all infrastructure instances.
- declare the public metrics and logs receiving endpoints.
- set secure credentials for client/server data shipment and collection.
As to do so, extend your platform’s ansible/inventories/group_vars/all/main.yml file with the following:
kowabunga_metrology_enabled: true
kowabunga_metrology_agent_metrics_enabled: true
kowabunga_metrology_agent_logs_enabled: true
kowabunga_metrology_server_metrics_public_url: "https://metrics.acme.com"
kowabunga_metrology_server_logs_public_url: "https://logs.acme.com"
and declare strong robust platform into ansible/inventories/group_vars/all.sops.yml:
secret_kowabunga_metrology_server_metrics_auth_password: ROBUST_PASSWORD_FOR_METRICS
secret_kowabunga_metrology_server_logs_auth_password: ROBUST_PASSWORD_FOR_LOGS
and apply for changes on all Kiwi and Kaktus instances:
$ kobra ansible deploy -p kowabunga.cloud.kiwi
$ kobra ansible deploy -p kowabunga.cloud.kaktus
Once done, all your private instances should now have a running Grafana Alloy agent, collecting the various local metrics (CPU usage, memory, network, disk, libvirt, Ceph …) and associated logs an pushing them to Kahuna remote endpoint.
Server-Side Enablement
It’s now time to handle server-side counter part. Let’s enable these into Kahuna’s configuration by extending the ansible/inventories/group_vars/kahuna/main.yml file:
kowabunga_metrology_dashboard_enabled: true
kowabunga_metrology_dashboard_public_url: "https://grafana.kowabunga.cloud"
kowabunga_metrology_server_metrics_enabled: true
kowabunga_metrology_server_metrics_retention_period: 7d

kowabunga_metrology_server_logs_enabled: true
kowabunga_metrology_server_logs_retention_period: 7d
and adding a secret for Grafana’s admin user in ansible/inventories/group_vars/kahuna.sops.yml:
secret_kowabunga_metrology_dashboard_admin_password: ROBUST_PASSWORD_FOR_GRAFANA_ADMIN
Note that in our example, we’ve limited metrics and logs retention server-side to 7 days. We’ll free to define different persistence duration that suits your needs.
Following Ansible collection documentation, you can also pre-configure additional Grafana users for your organization, e.g:
kowabunga_metrology_dashboard_extra_users:
  - name: John Doe
    login: jdoe
    email: jdoe@acme.com
    password: A_STRONG_ONE
Again, apply for changes on all Kahuna instance:
$ kobra ansible deploy -p kowabunga.cloud.kahuna
Once done, Kahuna will then starts collecting data from all infrastructure node (push, not pull) and Grafana will be ready to be consumed.
Provisioning Grafana dashboards
This stage unfortunately cannot be automated at the moment ;-(
Kowabunga comes bundled with ready-to-be-consumed dashboards. They are maintained in a dedicated GitHub repository and, if you’re familiar with Grafana, can’t be simply copy/pasted or imported.
Best option however is to take profit of Grafana v12 Git Sync feature. It allows you to seamlessly connect your Grafana instance to our (or yours forked one) GitHub dashboard repository.
Once configured, Grafana will automatically pull for any changes (so you’re always up-to-date) and any edition you’d make would automatically trigger a pull-request on save.
Setup can be performed (manually only) through Administration / Provisioning menu, as detailed below:
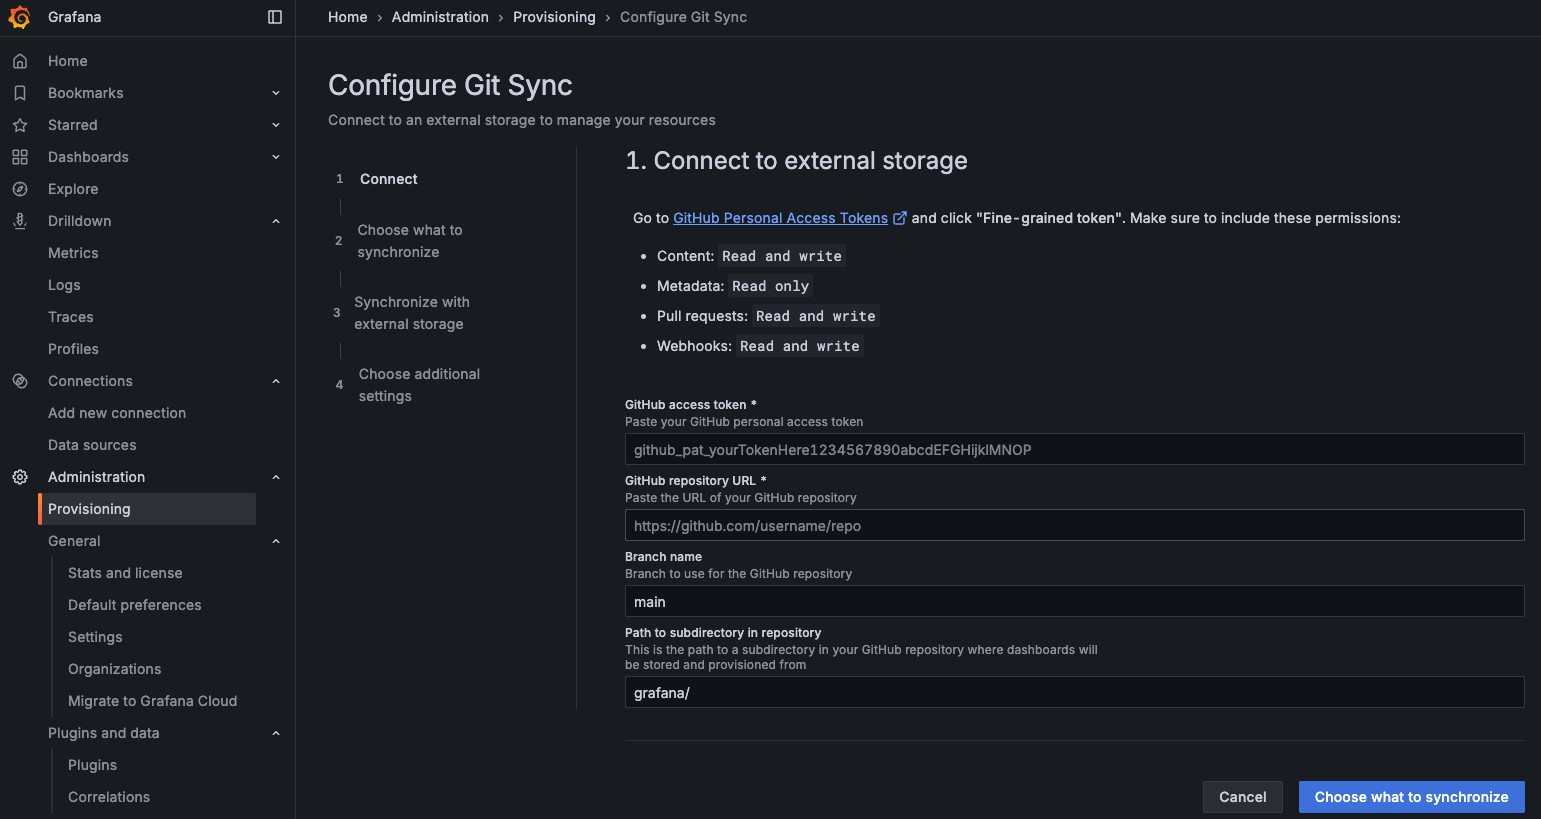
You’ll need to first setup a GitHub Personal Access Token (or PAT) to Kowabunga’ repository (or yours, for convenience).
Then simply forward the wizard:
- Repository URL: https://github.com/kowabunga-cloud/grafana-dashboards
- Branch name: master
- Path: grafana/
and wait for synchronization to happen.